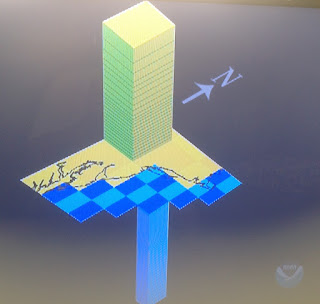
Climate model developers lack my external perspective. And I have an advantage over them: I observed, and was victimized by*, the evolution of oil reservoir models over the last 40 years. As it turns out, oil reservoir models are simpler versions of climate models. Lately they look like the picture in Figure 2.
Figure 2. Oil reservoir model. This diagram
shows a fine grid depicting geology and
geometry, the little lines are the wells.
Oil reservoir models are much simpler than their climate counterparts, but they both share the same basic architecture: climate models are like a multilayered bunch of flat dominoes wrapped around a spinning sphere. So it's hard to draw one.
Below are two diagrams I borrowed from NOAA:
Below are two diagrams I borrowed from NOAA:
Figure 3 NOAA's 2004 GFDL
Climate Model horizontal grid.
So what do these models include?
1. A three dimensional grid, which represents the modeled universe (the earth, an oil field) in a large collection of three dimensional objects joined side by side, or laying on top of each other, like a million domino pieces set in layers.
2. Fluids and fluid flows (such as oil, gas, and water or the atmosphere, the ocean, clouds, and greenhouse gases).
3. Energy flows (in the oil field models it's mostly pressures and temperatures, in climate models it's incoming sun light, energy moving between layers, the energy changes caused by evaporation and condensation...)
4. Basic physics, such as conservation of energy, momentum, and mass, as well as the principles describing how particles move in a spinning sphere, the way CO2 absorbs low energy photons and a big etc.
5. Parameterizations. This word means what we have to do to mimic small scale phenomena in a much larger scale environment. For example, let's say we are simulating a heated living room in winter, using a single "cube" (or grid cell), and we open a window. Somehow, the model has to work out how the cold air rushes into the room, cools it, cools the walls and the ceiling, and rushes out the living room's inner door into the hallway leading to the rest of the house. This "somehow", when that living room is a model cell, uses parameterizations. These are developed using full scale observations of nature, very fine grid models, lab experiments, or a guess if nothing else is available.
5. Time steps. The model has a starting point in time, and moves forward in measured time steps. These time steps have variable length, the important part to remember is that, almost every time step, calculations have to be made for almost every grid cell to describe what's going on inside the cell. And these calculations can involve dozens or hundreds of iterations, until the whole thing starts to make sense to the computer code that checks the grid, to make sure things fit, before it can move to the next time step.
6. Output processing and visualization. Both oil field and climate models have to be observed and understood. The results have to be compared to real data. And this is an incredible grind because they generate a gazillion number of data points.
I'm going to venture the guess than a climate model's detailed output would require several hundred thousand years to be fully visualized by its makers. This doesn't mean they can't understand what the model is doing (?). I think it means that, for every simulation run, they get so much output they can't really absorb all of it before they got to run off and write a paper or move on to the next set of runs.
How did I figure this out? Because oil field models are much smaller, simpler, and short lived, and we never absorb all the data dump from a single run before we move on. We don't have the time nor the brains to gather it all. We have computer programs to sort through the output, make plots, movies, and do some quality control. But we don't have artificial intelligences to look over the output.
What do I conclude from the above? Mostly that climate model results (especially those predictions about regional climates 50 years from now) have to be grabbed with gloves and handled with care.
Climate models will improve over time, but it's going to take 20 to 30 years before they'll be able to deliver the quality results I see being claimed for today's models.
We should use them. But I wouldn't recommend using them for much in a quantitative sense until I see a more honest approach by the "model expert community" (meaning their bosses) which recognizes their weaknesses and exposes them to the general public.
* victimized means I spent endless hours working with our staff not to overstate the oil field models' abilities to predict the future, and even more stressful hours explaining to management those PowerPoint slides with model results we used to justify $500 million gambles were "educated guesses" (sometimes they were pure bullshit, but this was hard to explain to managers who had metamorphosed into psychopathic bean counting robots with a 22 golf handicap).


Excellent analogy, and victimization description. I'm in the oil biz as well (engineer), and actually witnessed a team use a simulator for an exploration prospect in Venezuela (Delta Centro Block, perhaps you are familiar with it). Some of the folks even thought it was a useful exercise after we condemned the prospect with a dry hole! Never underestimate the power of cartoons...
ResponderEliminar